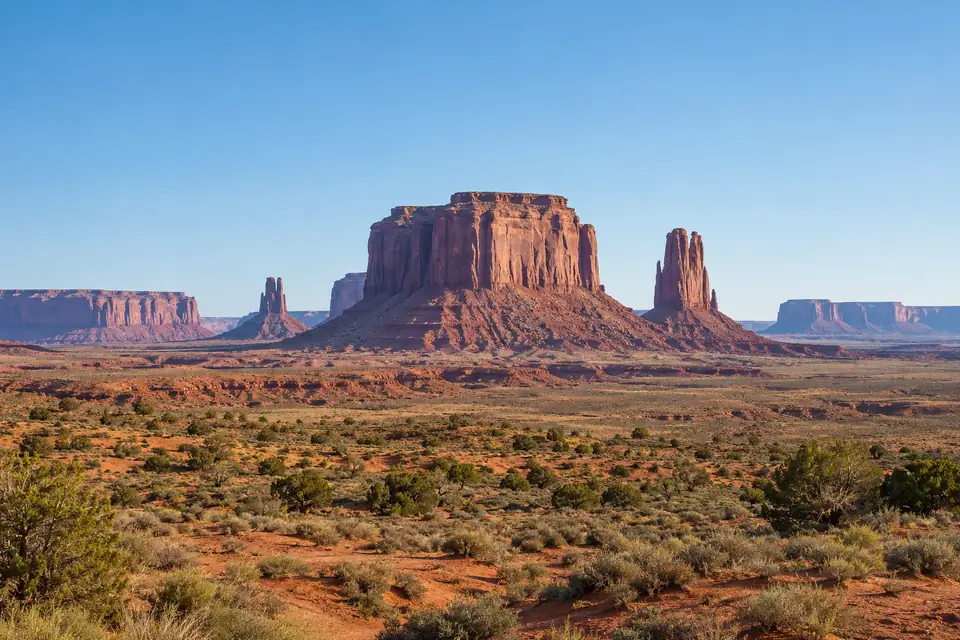
Hibbing, Minnesota
Hibbing, MN weather history and record highs today
Weather, monthly averages and records.
: November 2026 so far brought 4.26 in of precipitation in Hibbing, MN (1 day missing), the wettest 1 to 19 November on record, in 92 years since 1931 (2017 excluded: 10 of 19 days missing; 2018 excluded: 11 of 19 days missing; 2020 excluded: 4 of 19 days missing; 1 more year excluded for missing days); provisional.
Weather in Hibbing
- High
- 51°F
- Warmest since 2012
- 2nd warmest of 89
- Low
- 38°F
- Warmest since 1982
- 2nd warmest of 89
- Precipitation
- 0.03 in
- Wettest since 2024
- 16th wettest of 93
How does the day compare with the average?
The high of 51°F on Thursday 19 November 2026 in Hibbing, MN was 17.1°F above the average high for the date (33.9°F), warmer than 95 of every 100 days at this time of year (1991 to 2020). The low of 38°F on Thursday 19 November 2026 in Hibbing, MN was 21.1°F above the average low for the date (16.9°F), warmer than 98 of every 100 nights at this time of year (1991 to 2020).
The average 19 November in Hibbing, MN (1991 to 2020): a high of 33.9°F, and eight years in ten between 22°F and 43.1°F; a low of 16.9°F, and eight years in ten between 4.9°F and 28°F.
A high of 51°F or more on 19 November has happened in 2 of 89 years at the Hibbing, MN station, 2026 included; the last time before 2026 was 2012. A low of 38°F or more on 19 November has happened in 2 of 89 years at the Hibbing, MN station, 2026 included; the last time before 2026 was 1982.
At the Hibbing, MN station on 19 November: record high 53°F (2012), record low -10°F (2018).
1 January to 19 November 2026 averaged 43.2°F in Hibbing, MN, 2°F above the 1991 to 2020 average for those days (41.2°F), inside the range of 38.8°F to 44°F that eight years in ten fall in.
- Normal range, 4.9 to 28°F
Every year as a table
Every 19 November high in Hibbing, MN since 1938: 51°F in 2026; the highest is 53°F, in 2012.
| Year | High, °F | Low, °F |
|---|---|---|
| 2026 | 51 | 38 |
| 2025 | 37 | 15 |
| 2024 | 48 | 34 |
| 2023 | 47 | 17 |
| 2022 | 15 | 1 |
| 2021 | 34 | 6 |
| 2020 | 43 | 24 |
| 2019 | 33 | 27 |
| 2018 | 17 | -10 |
| 2017 | 22 | 3 |
| 2016 | 25 | 4 |
| 2015 | 35 | 20 |
| 2014 | 22 | 9 |
| 2013 | 41 | 14 |
| 2012 | 53 | 28 |
| 2011 | 29 | 9 |
| 2010 | 34 | 11 |
| 2009 | 44 | 27 |
| 2008 | 30 | 21 |
| 2007 | 43 | 28 |
| 2006 | 44 | 5 |
| 2005 | 34 | 28 |
| 2004 | 42 | 19 |
| 2003 | 40 | 24 |
| 2002 | 37 | 19 |
| 2001 | 34 | 16 |
| 2000 | 24 | 16 |
| 1999 | 38 | 26 |
| 1998 | 33 | 21 |
| 1997 | 25 | 11 |
| 1996 | 20 | 6 |
| 1995 | 35 | 25 |
| 1994 | 35 | 25 |
| 1993 | 34 | 11 |
| 1992 | 32 | 10 |
| 1991 | 40 | 31 |
| 1990 | 48 | 19 |
| 1989 | 44 | 18 |
| 1988 | 34 | 18 |
| 1987 | 33 | 16 |
| 1986 | 25 | 8 |
| 1985 | 34 | 13 |
| 1984 | 21 | 1 |
| 1983 | 38 | 32 |
| 1982 | 46 | 39 |
| 1981 | 28 | 21 |
| 1980 | 46 | 16 |
| 1979 | 48 | 34 |
| 1978 | 11 | 2 |
| 1977 | 29 | 7 |
| 1976 | 36 | 29 |
| 1975 | 39 | 28 |
| 1974 | 37 | 33 |
| 1973 | 32 | 17 |
| 1972 | 31 | 17 |
| 1971 | 29 | 24 |
| 1970 | 34 | 30 |
| 1969 | 16 | 8 |
| 1968 | 21 | 17 |
| 1967 | 29 | 6 |
| 1966 | 25 | 4 |
| 1965 | 23 | 17 |
| 1964 | 18 | -1 |
| 1963 | 49 | 21 |
| 1962 | 32 | 20 |
| 1961 | 33 | 15 |
| 1960 | 46 | 26 |
| 1959 | 27 | 1 |
| 1958 | 39 | 17 |
| 1957 | 25 | 19 |
| 1956 | 32 | 27 |
| 1955 | 25 | 10 |
| 1954 | 32 | 28 |
| 1953 | 44 | 31 |
| 1952 | 37 | 26 |
| 1951 | 18 | 2 |
| 1950 | 28 | 3 |
| 1949 | 33 | 28 |
| 1948 | 29 | 18 |
| 1947 | 28 | 21 |
| 1946 | 38 | 27 |
| 1945 | 28 | 11 |
| 1944 | 38 | 27 |
| 1943 | 42 | 25 |
| 1942 | 42 | 28 |
| 1941 | 47 | 31 |
| 1940 | 39 | 30 |
| 1939 | 37 | 23 |
| 1938 | 40 | 22 |
The forecast
| Date | High | Low |
|---|---|---|
| 54°FRecord at riskRecord 52°F, 1982 | 26°FRecord -14°F, 1978 | |
| Record 61°F, 1990 | Record -18°F, 1978 |
The month and the year
Every year's 1 to 19 November in Hibbing, MN, ranked by its mean temperature: November 2026 so far is the 4th warmest of 87.
Every year, ranked, as a table
| Rank | Year | Mean, °F |
|---|---|---|
| 1 | 2015 | 40.5 |
| 2 | 2001 | 39.8 |
| 3 | 1953 | 39.7 |
| 4 | 2026 | 39.6 |
| 5 | 1958 | 39.2 |
| 6 | 2016 | 38.7 |
| 7 | 1975 | 38 |
| 8 | 1964 | 37.7 |
| 9 | 1994 | 37.6 |
| 10 | 1999 | 37.5 |
| 11 | 1981 | 37.3 |
| 12 | 1944 | 36.8 |
| 13 | 1952 | 36.7 |
| 14 | 1956 | 36.5 |
| 15 | 2024 | 36.4 |
| 15 | 2009 | 36.4 |
| 17 | 1963 | 35.9 |
| 18 | 1954 | 35.8 |
| 19 | 1949 | 35.7 |
| 20 | 2010 | 35.1 |
| 21 | 1946 | 35 |
| 22 | 1987 | 34.3 |
| 23 | 2007 | 33.5 |
| 24 | 2004 | 33.4 |
| 25 | 2005 | 33.3 |
| 26 | 1957 | 33 |
| 26 | 1939 | 33 |
| 28 | 2020 | 32.9 |
| 28 | 2008 | 32.9 |
| 28 | 1948 | 32.9 |
| 31 | 2012 | 32.5 |
| 32 | 2023 | 32.4 |
| 33 | 1941 | 32.2 |
| 34 | 1971 | 31.9 |
| 35 | 1990 | 31.7 |
| 35 | 1983 | 31.7 |
| 37 | 2000 | 31.6 |
| 37 | 1974 | 31.6 |
| 37 | 1969 | 31.6 |
| 40 | 1960 | 31.4 |
| 41 | 2025 | 31.3 |
| 42 | 1961 | 31.1 |
| 43 | 1978 | 30.9 |
| 44 | 2011 | 30.7 |
| 45 | 2006 | 30.6 |
| 45 | 1970 | 30.6 |
| 45 | 1942 | 30.6 |
| 48 | 1988 | 30.4 |
| 48 | 1938 | 30.4 |
| 50 | 2013 | 30.2 |
| 51 | 2021 | 29.9 |
| 52 | 2022 | 29.5 |
| 53 | 1980 | 29.1 |
| 53 | 1962 | 29.1 |
| 55 | 1972 | 28.8 |
| 56 | 1968 | 28.6 |
| 57 | 1967 | 27.9 |
| 58 | 1998 | 27.7 |
| 58 | 1965 | 27.7 |
| 60 | 1950 | 27.5 |
| 61 | 1940 | 27.3 |
| 62 | 1985 | 27.1 |
| 63 | 1982 | 27 |
| 63 | 1947 | 27 |
| 65 | 1979 | 26.2 |
| 66 | 1943 | 26.1 |
| 67 | 1973 | 25.9 |
| 68 | 2003 | 25.8 |
| 69 | 1992 | 25.6 |
| 70 | 1984 | 25.5 |
| 70 | 1976 | 25.5 |
| 72 | 1945 | 25.4 |
| 73 | 1993 | 25.2 |
| 74 | 1996 | 25.1 |
| 75 | 1997 | 25 |
| 76 | 2002 | 24.5 |
| 77 | 1989 | 24.4 |
| 78 | 1955 | 23.9 |
| 79 | 2014 | 22.6 |
| 80 | 1991 | 21.7 |
| 81 | 2017 | 21.3 |
| 81 | 1966 | 21.3 |
| 81 | 1951 | 21.3 |
| 84 | 2018 | 20.2 |
| 85 | 2019 | 19.8 |
| 86 | 1986 | 19.1 |
| 87 | 1959 | 18.6 |
Every day as a table
Daily highs and lows in Hibbing, MN, 1 to 19 November 2026, with each date's record range and its 1991 to 2020 normal range.
| Day | High, °F | Low, °F | Record high | Year | Record low | Year | Normal high | Normal low |
|---|---|---|---|---|---|---|---|---|
| 64 | 45 | 69 | 1990 | 4 | 2023 | 41.1 | 26 | |
| 56 | 47 | 72 | 2022 | 0 | 1966 | 42.3 | 24.7 | |
| 57 | 51 | 70 | 2020 | 0 | 1951 | 42.3 | 22.1 | |
| 51 | 46 | 71 | 2020 | 0 | 1991 | 41.6 | 23.1 | |
| 46 | 24 | 72 | 1975 | 5 | 2019 | 41.7 | 24.8 | |
| 45 | 19 | 70 | 2020 | -2 | 1991 | 41.8 | 24.6 | |
| 47 | 24 | 64 | 2020 | -14 | 1991 | 41.5 | 21.6 | |
| 47 | 27 | 70 | 1999 | -11 | 2003 | 39.2 | 21.2 | |
| 59 | 26 | 65 | 1999 | -9 | 2017 | 40.4 | 21.8 | |
| 54 | 27 | 62 | 2010 | -12 | 2017 | 36.6 | 20.6 | |
| 42 | 33 | 59 | 1961 | -8 | 1986 | 36.1 | 18.7 | |
| 36 | 20 | 58 | 1987 | -13 | 2019 | 35.3 | 19.1 | |
| 34 | 15 | 64 | 1999 | -12 | 1995 | 37.1 | 19.2 | |
| 42 | 14 | 62 | 1953 | -5 | 1959 | 37.3 | 19.5 | |
| 49 | 15 | 60 | 2001 | -8 | 2014 | 35.4 | 19.4 | |
| 54 | 30 | 60 | 1953 | -6 | 2002 | 34.4 | 18.8 | |
| 45 | 27 | 67 | 2001 | -9 | 1959 | 35.7 | 20.1 | |
| 52 | 44 | 67 | 1953 | -2 | 2018 | 34.7 | 19.5 | |
| 51 | 38 | 53 | 2012 | -10 | 2018 | 33.9 | 16.9 |
The warmest, coldest and wettest on this date
| Rank | Year | High, °F |
|---|---|---|
| 1 | 2012 | 53 |
| 2 | 2026 | 51 |
| 3 | 1963 | 49 |
| 4 | 2024 | 48 |
| 4 | 1990 | 48 |
| 4 | 1979 | 48 |
| 7 | 2023 | 47 |
| 7 | 1941 | 47 |
| 9 | 1982 | 46 |
| 9 | 1980 | 46 |
| 9 | 1960 | 46 |
| 12 | 2009 | 44 |
| 12 | 2006 | 44 |
| 12 | 1989 | 44 |
| 12 | 1953 | 44 |
| 16 | 2020 | 43 |
| 16 | 2007 | 43 |
| 18 | 2004 | 42 |
| 18 | 1943 | 42 |
| 18 | 1942 | 42 |
| Rank | Year | Low, °F |
|---|---|---|
| 1 | 2018 | -10 |
| 2 | 1964 | -1 |
| 3 | 2022 | 1 |
| 3 | 1984 | 1 |
| 3 | 1959 | 1 |
| 6 | 1978 | 2 |
| 6 | 1951 | 2 |
| 8 | 2017 | 3 |
| 8 | 1950 | 3 |
| 10 | 2016 | 4 |
| 10 | 1966 | 4 |
| 12 | 2006 | 5 |
| 13 | 2021 | 6 |
| 13 | 1996 | 6 |
| 13 | 1967 | 6 |
| 16 | 1977 | 7 |
| 17 | 1986 | 8 |
| 17 | 1969 | 8 |
| 19 | 2014 | 9 |
| 19 | 2011 | 9 |
| Rank | Year | Precipitation, in |
|---|---|---|
| 1 | 2024 | 0.79 |
| 2 | 1975 | 0.44 |
| 3 | 1977 | 0.39 |
| 4 | 1983 | 0.38 |
| 5 | 1986 | 0.37 |
| 6 | 1982 | 0.35 |
| 7 | 1957 | 0.31 |
| 8 | 1949 | 0.25 |
| 9 | 1988 | 0.19 |
| 10 | 1979 | 0.12 |
| 11 | 1974 | 0.10 |
| 12 | 1965 | 0.09 |
| 13 | 2000 | 0.05 |
| 13 | 1952 | 0.05 |
| 15 | 1985 | 0.04 |
| 16 | 2026 | 0.03 |
| 16 | 2010 | 0.03 |
| 16 | 1998 | 0.03 |
| 16 | 1971 | 0.03 |
| 16 | 1966 | 0.03 |
Every answer in words
- Thursday 19 November 2026: a high of 51°F in Hibbing, MN, the warmest 19 November since 2012, 2nd warmest of 89.
- Thursday 19 November 2026: a low of 38°F in Hibbing, MN, the warmest 19 November night since 1982, 2nd warmest of 89.
- Thursday 19 November 2026: 0.03 in of precipitation in Hibbing, MN, the wettest 19 November since 2024, tied 16th wettest of 93 (with 2010, 1998, 1971 and 1 other year).
- Forecast for Friday 20 November 2026: a high of 54°F in Hibbing, MN, which would beat the record for the warmest 20 November, 52°F in 1982 (National Weather Service forecast).
- Forecast for Friday 20 November 2026: a low of 26°F in Hibbing, MN, which would be the warmest 20 November night since 2025, tied 19th warmest of 89 (with 2023, 1983, 1976 and 1 other year) (National Weather Service forecast).
- Hibbing, MN on 20 November: record high 52°F (1982), record low -14°F (1978).
- Hibbing, MN on 21 November: record high 61°F (1990), record low -18°F (1978).
- November 2026 so far averaged 39.6°F in Hibbing, MN, the warmest 1 to 19 November since 2015, 4th warmest of 87.
- Fall 2026 so far averaged 48.8°F in Hibbing, MN, the warmest 1 September to 19 November since 2015, 6th warmest of 89.
- Fall 2026 so far brought 9.40 in of precipitation in Hibbing, MN (1 day missing), the wettest 1 September to 19 November since 2015 (2017 excluded: 10 of 80 days missing; 2018 excluded: 16 of 80 days missing; 2020 excluded: 17 of 80 days missing), 8th wettest of 93.
- 2026 so far averaged 43.2°F in Hibbing, MN, the warmest 1 January to 19 November since 2024, 16th warmest of 88.
- 2026 so far brought 25.85 in of precipitation in Hibbing, MN (2 days missing), the wettest 1 January to 19 November since 2022, 31st wettest of 92.
- Hibbing, MN has had 4 days at 90°F or above in 2026 through 19 November, the most by that date since 2021, tied 17th most of 88 (with 2021, 2012, 2006 and 5 other years).
- Hibbing, MN has had 154 freezing nights (a low of 32°F or below) in 2026 through 19 November, the most by that date since 2025, 51st most of 88.
- The first freeze of fall 2026 in Hibbing, MN came on Monday 14 September 2026, the earliest since 2025, tied 41st earliest of 89 (with 2016 and 1987).
- The last freeze of spring 2026 in Hibbing, MN came on Thursday 21 May 2026, the latest since 2025, tied 56th latest of 87 (with 1997 and 1982).
Hibbing, MN had 4 days at 90°F or above from 1 January to 19 November 2026; the 1991 to 2020 average for those days is 2 (between 0 and 6 in eight years of ten).
Hibbing, MN had 154 freezing nights (a low of 32°F or below) from 1 January to 19 November 2026; the 1991 to 2020 average for those days is 163 (between 150 and 177 in eight years of ten).
The last freeze of spring 2026 in Hibbing, MN was on 21 May; the typical last freeze of spring (1991 to 2020) is 1 June, with eight years in ten between 16 May and 14 June.
The first freeze of fall 2026 in Hibbing, MN was on 14 September; the typical first freeze of fall (1991 to 2020) is 12 September, with eight years in ten between 30 August and 21 September.
Weather records in Hibbing

How is the year so far comparing with normal?
2026 so far · to
43.2°F
+2°F vs normal
Mean temperature
Warmest since 2024
16th warmest of 88
Normal: 41.2°F
25.85 in Precipitation
November 2026 so far · to
39.6°F
+9.5°F vs normal
Mean temperature
Warmest since 2015
4th warmest of 87
Normal: 30.1°F
4.26 in Precipitation
How many hot days this year?
to
4 days at 90°F or above Normal 2
How has the yearly average temperature at the Hibbing, MN station changed?
−0.3°F per decade
1996 to 2025 · Fitted station trend
These yearly figures are for one station, HIBBING CHISHOLM HIBBING AP (1,339 feet above sea level), which has reported since 1962; the city's longer record joins other stations and is not used here.
- Annual mean temperature, °F
- Station normal, 38.3°F
The last ten complete years at the Hibbing, MN station (2016 to 2025) averaged 38.1°F, 0.2°F below the 1991 to 2020 average (38.3°F).
Yearly average temperature at the Hibbing, MN station: 37.2°F in the 1970s, 38.1°F in the 2010s and 38.8°F in the 2020s so far (6 years).
- 2.7°F or more below the 1991 to 2020 average
- 1.8 to 2.7°F below
- 0.9 to 1.8°F below
- within 0.9°F of the average
- 0.9 to 1.8°F above
- 1.8 to 2.7°F above
- 2.7°F or more above the 1991 to 2020 average
Every year at the station as a table
| Decade | …0 | …1 | …2 | …3 | …4 | …5 | …6 | …7 | …8 | …9 | Decade average |
|---|---|---|---|---|---|---|---|---|---|---|---|
| 1960s | 37.1 | 38.2 | 37.6 | 35.3 | 36.1 | 35.7 | 37.9 | 37.7 | 37 | ||
| 1970s | 36.9 | 37 | 34.9 | 39.7 | 37 | 37.8 | 36.9 | 39 | 37 | 35.8 | 37.2 |
| 1980s | 37.7 | 39.3 | 36.5 | 38.1 | 38.2 | 36.1 | 38.6 | 41.8 | 38.3 | 35.2 | 38 |
| 1990s | 38.3 | 38.1 | 37.7 | 36.4 | 39.2 | 38.5 | 35.1 | 38.9 | 42.8 | 41.4 | 38.6 |
| 2000s | 38.5 | 39.3 | 37.7 | 37.9 | 36.9 | 38.8 | 40.5 | 38.9 | 35.4 | 36.9 | 38.1 |
| 2010s | 40.5 | 38.7 | 40.9 | 36.7 | 36 | 40.3 | 39.3 | 37.2 | 36.2 | 35.3 | 38.1 |
| 2020s | 37.8 | 40 | 35.5 | 39.7 | 41.2 | 38.3 | 38.8 |
| Decade | Years | Yearly average, °F | Yearly precipitation, in |
|---|---|---|---|
| 1960s | 8 | 37 | 24.2 |
| 1970s | 10 | 37.2 | 25.3 |
| 1980s | 10 | 38 | 25.9 |
| 1990s | 10 | 38.6 | 28.8 |
| 2000s | 10 | 38.1 | 20.4 |
| 2010s | 10 | 38.1 | 25.2 |
| 2020s | 6 | 38.8 | 23.6 |
Yearly precipitation at the Hibbing, MN station averaged 20.4 in in the 2000s, its driest decade, and 28.8 in in the 1990s, its wettest.
Months, seasons and years
Months
Seasons
Years
Explore more of Minnesota
Duluth, MN
47.9 mi
International Falls, MN
85.5 mi
Brainerd, MN
91.1 mi
Ashland, WI
107.1 mi
Hayward, WI
114.2 mi
St. Louis County, MN
county average
Minnesota
every city and county
About these figures
Daily records for Hibbing, MN run from 1931 to 19 November 2026, with 2735 days missing; current station HIBBING CHISHOLM HIBBING AP.
Our calculation from NOAA records for Hibbing, MN, 1931 to 2026. Preliminary until NOAA's final data.