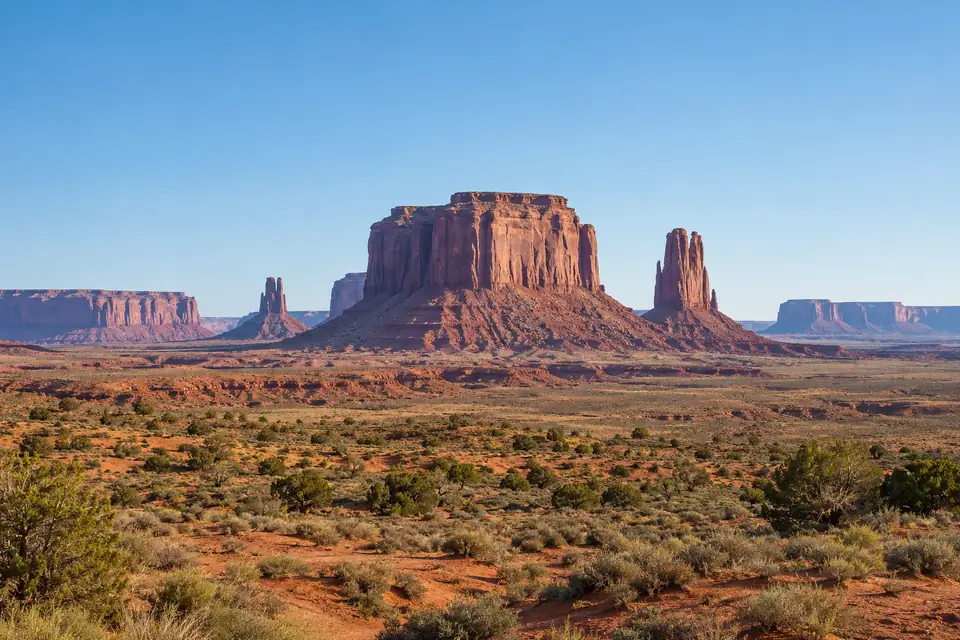
Omak, Washington
Omak, WA weather history and record highs today
Weather, monthly averages and records.
The 60 days to Thursday brought 0.39 in of precipitation in Omak, WA, the driest 60 days to 19 November since 1990 (1991 excluded: 60 of 60 days missing; 1992 excluded: 9 of 60 days missing; 1993 excluded: 34 of 60 days missing; 4 more years excluded for missing days), 7th driest of 103.
Weather in Omak
- High
- 44°F
- Warmest since 2025
- 43rd warmest of 112
- Low
- 32°F
- Warmest since 2025
- 40th warmest of 112
No measurable precipitation in Omak, WA for 4 days to Thursday 19 November 2026.
How does the day compare with the average?
The high of 44°F on Thursday 19 November 2026 in Omak, WA was 1.7°F above the 1991 to 2020 average high for the date (42.3°F). The low of 32°F on Thursday 19 November 2026 in Omak, WA was 4.6°F above the 1991 to 2020 average low for the date (27.4°F).
The average 19 November in Omak, WA (1991 to 2020): a high of 42.3°F, and eight years in ten between 33.6°F and 52.8°F; a low of 27.4°F, and eight years in ten between 15.2°F and 39.2°F.
A high of 44°F or more on 19 November has happened in 49 of 112 years at the Omak, WA station, 2026 included; the last time before 2026 was 2025. A low of 32°F or more on 19 November has happened in 47 of 112 years at the Omak, WA station, 2026 included; the last time before 2026 was 2025.
At the Omak, WA station on 19 November: record high 67°F (1932), record low 2°F (2022).
- Normal range, 15.2 to 39.2°F
Every year as a table
Every 19 November high in Omak, WA since 1910: 44°F in 2026; the highest is 67°F, in 1932.
| Year | High, °F | Low, °F |
|---|---|---|
| 2026 | 44 | 32 |
| 2025 | 44 | 35 |
| 2024 | 35 | 25 |
| 2023 | 50 | 27 |
| 2022 | 17 | 2 |
| 2021 | 45 | 27 |
| 2020 | 46 | 27 |
| 2019 | 51 | 41 |
| 2018 | 42 | 18 |
| 2017 | 41 | 33 |
| 2016 | 38 | 29 |
| 2015 | 43 | 26 |
| 2014 | 40 | 24 |
| 2013 | 57 | 30 |
| 2012 | 54 | 42 |
| 2011 | 33 | 8 |
| 2010 | 32 | 25 |
| 2009 | 48 | 38 |
| 2008 | 46 | 33 |
| 2007 | 38 | 27 |
| 2006 | 43 | 31 |
| 2005 | 38 | 29 |
| 2004 | 49 | 21 |
| 2003 | 56 | 23 |
| 2002 | 52 | 42 |
| 2001 | 41 | 32 |
| 2000 | 34 | 14 |
| 1999 | 43 | 33 |
| 1998 | 37 | 19 |
| 1997 | 38 | 33 |
| 1996 | 20 | 14 |
| 1993 | 38 | 16 |
| 1992 | 44 | 32 |
| 1990 | 44 | 31 |
| 1989 | 46 | 40 |
| 1988 | 40 | 26 |
| 1987 | 46 | 31 |
| 1986 | 50 | 32 |
| 1984 | 46 | 40 |
| 1983 | 40 | |
| 1982 | 40 | 29 |
| 1981 | 45 | 33 |
| 1980 | 47 | 36 |
| 1979 | 39 | 19 |
| 1978 | 23 | 18 |
| 1977 | 33 | 25 |
| 1976 | 41 | 15 |
| 1975 | 32 | 21 |
| 1974 | 40 | 24 |
| 1973 | 33 | 19 |
| 1972 | 41 | 35 |
| 1971 | 40 | 34 |
| 1970 | 45 | 21 |
| 1969 | 44 | 25 |
| 1968 | 42 | 35 |
| 1967 | 49 | 37 |
| 1966 | 42 | 31 |
| 1965 | 57 | 38 |
| 1964 | 40 | 33 |
| 1963 | 38 | 26 |
| 1962 | 57 | 33 |
| 1961 | 34 | 20 |
| 1960 | 45 | 30 |
| 1959 | 34 | 20 |
| 1958 | 29 | 16 |
| 1957 | 38 | 24 |
| 1956 | 32 | 13 |
| 1955 | 25 | 5 |
| 1954 | 59 | 43 |
| 1953 | 36 | 32 |
| 1952 | 41 | 36 |
| 1951 | 36 | 24 |
| 1950 | 30 | 18 |
| 1949 | 51 | 36 |
| 1948 | 36 | 30 |
| 1947 | 39 | 23 |
| 1946 | 22 | 15 |
| 1945 | 46 | 23 |
| 1944 | 36 | 33 |
| 1943 | 45 | 36 |
| 1942 | 42 | 34 |
| 1941 | 47 | 28 |
| 1940 | 42 | 16 |
| 1939 | 49 | 26 |
| 1938 | 52 | 40 |
| 1937 | 38 | 32 |
| 1936 | 47 | 27 |
| 1935 | 37 | 32 |
| 1934 | 51 | 41 |
| 1933 | 44 | 39 |
| 1932 | 67 | 35 |
| 1931 | 54 | 32 |
| 1930 | 31 | 12 |
| 1929 | 39 | 11 |
| 1928 | 36 | 18 |
| 1927 | 44 | 30 |
| 1926 | 42 | 27 |
| 1925 | 52 | |
| 1924 | 45 | 35 |
| 1923 | 45 | 41 |
| 1922 | 46 | 28 |
| 1921 | 24 | 7 |
| 1920 | 57 | 43 |
| 1919 | 56 | 38 |
| 1918 | 46 | 28 |
| 1917 | 41 | 24 |
| 1916 | 38 | 10 |
| 1915 | 36 | 29 |
| 1914 | 36 | 31 |
| 1913 | 42 | 34 |
| 1912 | 57 | 35 |
| 1911 | 47 | 33 |
| 1910 | 43 | 35 |
The forecast
| Date | High | Low |
|---|---|---|
| 41°FRecord 58°F, 1962 | 27°FRecord 4°F, 1921 | |
| Record 58°F, 1911 | Record 1°F, 1977 |
The month and the year
Every year's 1 to 19 November in Omak, WA, ranked by its mean temperature: November 2026 so far is the 9th warmest of 103.
Every year, ranked, as a table
| Rank | Year | Mean, °F |
|---|---|---|
| 1 | 2016 | 45 |
| 2 | 1934 | 44.6 |
| 3 | 1983 | 44 |
| 4 | 1987 | 43.5 |
| 5 | 2025 | 43.4 |
| 6 | 1954 | 43 |
| 7 | 1990 | 42.5 |
| 7 | 1989 | 42.5 |
| 9 | 2026 | 42.4 |
| 10 | 1918 | 42.2 |
| 11 | 1981 | 42 |
| 11 | 1941 | 42 |
| 13 | 1917 | 41.8 |
| 14 | 1999 | 41.6 |
| 15 | 1965 | 41.5 |
| 16 | 2015 | 41.3 |
| 16 | 1980 | 41.3 |
| 18 | 1988 | 41.2 |
| 18 | 1962 | 41.2 |
| 18 | 1926 | 41.2 |
| 21 | 1998 | 41.1 |
| 21 | 1944 | 41.1 |
| 21 | 1933 | 41.1 |
| 24 | 1931 | 41 |
| 25 | 1949 | 40.9 |
| 26 | 2008 | 40.7 |
| 27 | 2012 | 40.5 |
| 28 | 2021 | 40.4 |
| 28 | 2001 | 40.4 |
| 28 | 1912 | 40.4 |
| 31 | 1972 | 40.3 |
| 32 | 1923 | 40.1 |
| 33 | 2010 | 40 |
| 34 | 1920 | 39.9 |
| 35 | 1967 | 39.7 |
| 36 | 1925 | 39.6 |
| 37 | 1921 | 39.5 |
| 38 | 1966 | 39.4 |
| 38 | 1913 | 39.4 |
| 40 | 2019 | 39.3 |
| 40 | 1937 | 39.3 |
| 42 | 1974 | 39.2 |
| 43 | 2023 | 39.1 |
| 43 | 1976 | 39.1 |
| 43 | 1963 | 39.1 |
| 46 | 1914 | 39 |
| 47 | 1939 | 38.9 |
| 48 | 1953 | 38.8 |
| 49 | 1984 | 38.7 |
| 50 | 2024 | 38.6 |
| 50 | 2007 | 38.6 |
| 52 | 2020 | 38.5 |
| 53 | 2004 | 38.4 |
| 53 | 1969 | 38.4 |
| 55 | 1975 | 38.3 |
| 56 | 2013 | 38.1 |
| 56 | 2009 | 38.1 |
| 58 | 1957 | 38 |
| 59 | 1922 | 37.9 |
| 60 | 2018 | 37.8 |
| 60 | 1943 | 37.8 |
| 62 | 1964 | 37.7 |
| 62 | 1938 | 37.7 |
| 64 | 1942 | 37.6 |
| 65 | 2006 | 37.5 |
| 66 | 2002 | 37.3 |
| 67 | 1970 | 37.1 |
| 68 | 1977 | 37 |
| 68 | 1930 | 37 |
| 68 | 1928 | 37 |
| 68 | 1924 | 37 |
| 72 | 1952 | 36.9 |
| 73 | 1947 | 36.5 |
| 74 | 1960 | 36.3 |
| 75 | 1979 | 36.2 |
| 76 | 2017 | 36.1 |
| 77 | 1968 | 36 |
| 77 | 1956 | 36 |
| 79 | 1919 | 35.8 |
| 80 | 2014 | 35.6 |
| 80 | 1927 | 35.6 |
| 82 | 1958 | 35.5 |
| 83 | 1982 | 35.4 |
| 84 | 2005 | 35.2 |
| 84 | 1971 | 35.2 |
| 86 | 1950 | 35 |
| 86 | 1948 | 35 |
| 88 | 1915 | 34.8 |
| 89 | 1973 | 33.9 |
| 90 | 1951 | 33.7 |
| 91 | 1929 | 33.4 |
| 92 | 1946 | 32.6 |
| 92 | 1940 | 32.6 |
| 92 | 1916 | 32.6 |
| 95 | 2003 | 32.5 |
| 96 | 1961 | 32.3 |
| 96 | 1936 | 32.3 |
| 98 | 1935 | 32.2 |
| 99 | 1978 | 32 |
| 100 | 1911 | 30.8 |
| 101 | 2011 | 30.3 |
| 102 | 1959 | 27.7 |
| 103 | 1955 | 26.3 |
Every day as a table
Daily highs and lows in Omak, WA, 1 to 19 November 2026, with each date's record range and its 1991 to 2020 normal range.
| Day | High, °F | Low, °F | Record high | Year | Record low | Year | Normal high | Normal low |
|---|---|---|---|---|---|---|---|---|
| 55 | 37 | 63 | 1981 | 5 | 2002 | |||
| 48 | 29 | 68 | 2018 | 7 | 2002 | |||
| 49 | 30 | 69 | 1975 | 7 | 2002 | 49.2 | 29.3 | |
| 52 | 26 | 67 | 1975 | 12 | 2002 | 50.1 | 30.1 | |
| 49 | 43 | 64 | 2020 | 10 | 2003 | 48 | 30.2 | |
| 50 | 42 | 60 | 2014 | 11 | 2003 | |||
| 52 | 34 | 77 | 1910 | 13 | 2011 | 46.6 | 31.3 | |
| 61 | 36 | 61 | 2016 | 9 | 1945 | |||
| 48 | 33 | 71 | 1989 | 10 | 1945 | |||
| 48 | 42 | 71 | 1990 | 5 | 2022 | 47.6 | 30 | |
| 57 | 43 | 62 | 1990 | 2 | 1911 | |||
| 46 | 41 | 61 | 1999 | 3 | 1955 | 45.9 | 29.6 | |
| 42 | 36 | 62 | 2015 | 0 | 1955 | |||
| 54 | 40 | 59 | 2016 | 3 | 1955 | |||
| 53 | 41 | 63 | 2021 | 1 | 1955 | |||
| 50 | 29 | 58 | 1938 | -3 | 1955 | |||
| 47 | 27 | 56 | 1920 | 5 | 1916 | |||
| 41 | 26 | 55 | 2003 | 5 | 1930 | 42.8 | ||
| 44 | 32 | 67 | 1932 | 2 | 2022 | 42.3 | 27.4 |
The warmest, coldest and wettest on this date
| Rank | Year | High, °F |
|---|---|---|
| 1 | 1932 | 67 |
| 2 | 1954 | 59 |
| 3 | 2013 | 57 |
| 3 | 1965 | 57 |
| 3 | 1962 | 57 |
| 3 | 1920 | 57 |
| 3 | 1912 | 57 |
| 8 | 2003 | 56 |
| 8 | 1919 | 56 |
| 10 | 2012 | 54 |
| 10 | 1931 | 54 |
| 12 | 2002 | 52 |
| 12 | 1938 | 52 |
| 12 | 1925 | 52 |
| 15 | 2019 | 51 |
| 15 | 1949 | 51 |
| 15 | 1934 | 51 |
| 18 | 2023 | 50 |
| 18 | 1986 | 50 |
| 20 | 2004 | 49 |
| Rank | Year | Low, °F |
|---|---|---|
| 1 | 2022 | 2 |
| 2 | 1955 | 5 |
| 3 | 1921 | 7 |
| 4 | 2011 | 8 |
| 5 | 1916 | 10 |
| 6 | 1929 | 11 |
| 7 | 1930 | 12 |
| 8 | 1956 | 13 |
| 9 | 2000 | 14 |
| 9 | 1996 | 14 |
| 11 | 1976 | 15 |
| 11 | 1946 | 15 |
| 13 | 1993 | 16 |
| 13 | 1958 | 16 |
| 13 | 1940 | 16 |
| 16 | 2018 | 18 |
| 16 | 1978 | 18 |
| 16 | 1950 | 18 |
| 16 | 1928 | 18 |
| 20 | 1998 | 19 |
| Rank | Year | Precipitation, in |
|---|---|---|
| 1 | 1966 | 0.52 |
| 2 | 1963 | 0.48 |
| 3 | 1927 | 0.43 |
| 4 | 2012 | 0.37 |
| 5 | 1992 | 0.34 |
| 5 | 1948 | 0.34 |
| 7 | 1920 | 0.32 |
| 8 | 1953 | 0.29 |
| 9 | 1962 | 0.27 |
| 9 | 1954 | 0.27 |
| 11 | 1937 | 0.24 |
| 12 | 1919 | 0.23 |
| 13 | 1934 | 0.20 |
| 14 | 1924 | 0.19 |
| 15 | 2001 | 0.18 |
| 15 | 1930 | 0.18 |
| 17 | 1910 | 0.16 |
| 18 | 1983 | 0.14 |
| 19 | 1974 | 0.12 |
| 20 | 2009 | 0.11 |
Every answer in words
- Thursday 19 November 2026: a high of 44°F in Omak, WA, the warmest 19 November since 2025, tied 43rd warmest of 112 (with 2025, 1992, 1990 and 3 other years).
- Thursday 19 November 2026: a low of 32°F in Omak, WA, the warmest 19 November night since 2025, tied 40th warmest of 112 (with 2001, 1992, 1986 and 4 other years).
- Forecast for Friday 20 November 2026: a high of 41°F in Omak, WA, which would be the coldest 20 November day since 2024, tied 49th coldest of 112 (with 2017, 1990, 1945 and 1 other year) (National Weather Service forecast).
- Forecast for Friday 20 November 2026: a low of 27°F in Omak, WA, which would be the coldest 20 November night since 2023, tied 47th coldest of 112 (with 1932 and 1919) (National Weather Service forecast).
- Omak, WA on 20 November: record high 58°F (1962), record low 4°F (1921).
- Omak, WA on 21 November: record high 58°F (1911), record low 1°F (1977).
- November 2026 so far averaged 42.4°F in Omak, WA, the warmest 1 to 19 November since 2025, 9th warmest of 103.
- November 2026 so far brought 0.27 in of precipitation in Omak, WA, the driest 1 to 19 November since 2018 (2022 excluded: 2 of 19 days missing), tied 16th driest of 104 (with 1987 and 1967).
- Fall 2026 so far averaged 53.3°F in Omak, WA, the warmest 1 September to 19 November since 2025, tied 17th warmest of 105 (with 2020).
- Fall 2026 so far brought 0.87 in of precipitation in Omak, WA, the driest 1 September to 19 November since 2000, tied 11th driest of 103 (with 1949).
- 2026 so far averaged 55.1°F in Omak, WA, the warmest 1 January to 19 November since 2021, tied 5th warmest of 104 (with 2021 and 1983).
- 2026 so far brought 4.24 in of precipitation in Omak, WA, the driest 1 January to 19 November since 2000, 3rd driest of 104.
- The 30 days to Thursday 19 November 2026 brought 0.34 in of precipitation in Omak, WA, the driest 30 days to 19 November since 2011, 12th driest of 106.
- The 90 days to Thursday 19 November 2026 brought 0.92 in of precipitation in Omak, WA, the driest 90 days to 19 November since 2000, tied 11th driest of 103 (with 1939).
- Omak, WA has had 46 days at 90°F or above in 2026 through 19 November, the most by that date since 2025, tied 32nd most of 104 (with 2025 and 2006).
- Omak, WA has had 2 days at 100°F or above in 2026 through 19 November, the most by that date since 2025, tied 63rd most of 104 (with 2016, 2000, 1999 and 6 other years).
- Omak, WA has had 80 freezing nights (a low of 32°F or below) in 2026 through 19 November, the most by that date since 2025, 101st most of 104.
- The first freeze of fall 2026 in Omak, WA came on Wednesday 21 October 2026, the earliest since 2025, 99th earliest of 105.
- The last freeze of spring 2026 in Omak, WA came on Sunday 26 April 2026, the latest since 2025, tied 91st latest of 105 (with 1957 and 1912).
Weather records in Omak

How is the year so far comparing with normal?
2026 so far · to
55.1°F
Mean temperature
Warmest since 2021
5th warmest of 104
4.24 in Precipitation
November 2026 so far · to
42.4°F
Mean temperature
Warmest since 2025
9th warmest of 103
0.27 in Precipitation
Months, seasons and years
Months
Seasons
Years
Explore more of Washington

Spokane, WA
108.8 mi
Seattle, WA
137.1 mi
Yakima, WA
139.4 mi
Seattle Tacoma, WA
147.1 mi
Tri-Cities, WA
152.6 mi
Okanogan County, WA
county average
Washington
every city and county
About these figures
Daily records for Omak, WA run from 1909 to 19 November 2026, with 2084 days missing; current station OMAK.
Our calculation from NOAA records for Omak, WA, 1909 to 2026. Preliminary until NOAA's final data.